To compare and contrast the way Universal Analytics (UA) and its newest version, Google Analytics 4 (GA4) collect data, we sampled multiple clients with both accounts over the month of October 2022. When comparing the UA and GA4 data side by side, we observed variations that average a 23% difference in the numbers between the platforms. We will be expanding further on the discrepancies found during this study.
Why are divergences in Universal Analytics and Google Analytics 4 data important?
The upcoming switch to Google Analytics 4 is approaching. After July 1st, 2023 the Universal Analytics platform will be going away forever and leaving behind Google Analytics 4 to take over all web analytics for website traffic online. It is important to better understand and depict the way data is measured across the two platforms for utmost success when setting website traffic goals.
Comparing Data from Universal Analytics with Data from Google Analytics 4
Throughout the month of October, we sampled over 30 clients that had active Universal Analytics and Google Analytics 4 accounts on their websites. We measured the data from both accounts focusing on three main metrics: User data, Session data, and Conversions data. Considering that these metrics do not translate exactly from UA over to GA4, the numbers we used are the closest equivalents of each other for the most accurate comparison.
Although changes are expected when using a new platform, the differences need to be acknowledged. We calculated that there was an average of 5.3% difference in User data, a 3.2% difference in the Session data, and an astounding 65% difference in Goals data. Overall a 23% percent difference in all data when aggregated.
What are the differences in User data in UA and GA4?
One of the main differences between User data in UA and GA4 is the primary metrics used. In UA, the primary metric is Total Users. This means that all users that visit the site are counted equally. In GA4, the primary metric used is Active Users. Only users that have an engaged session with the website are counted. An active user is described as someone who has been on any page longer than 10 seconds, completed a conversion event, or viewed two pages.
Another difference is that Google states that GA4 is able to differentiate users across different platforms and devices. We are speculating this means that someone using their laptop and phone simultaneously would only be counted once in GA4 as opposed to twice in UA. This may have resulted in an average of 5.2% lower User data. However, even though traffic may appear lower in GA4, it is more certain that your users are not being duplicated and are engaging with your content.
How are Sessions data in UA and GA4 divergent?
The difference between Sessions data in UA and GA4 was smaller than the User data percentage with an average of a 3.2% change. This is most likely due to the fact that the definition of a session in UA versus in GA4 is fairly similar. Therefore, the numbers did not have a very noticeable change.
The big adjustment is that GA4 will be moving from grouping data into sessions to grouping it into events. An event consists of any interaction the user has with the website. This is completely customizable but some events that are automatically collected according to Zac Duncan from Root and Branch Group are:
session_start
first_visit
user_engagement
Why are conversions measured so differently in UA and GA4?
The biggest difference in our data happened when measuring conversions with an average percentage change of 65%. This correlates to what we mentioned above. Sessions are now events and events can equal conversions. We noticed that GA4 had higher conversion data than UA due to GA4 counting every event that occurred as a conversion. For example, GA4 was counting every single form fill or phone click despite the fact that it may have been clicked twice (or multiple times) by a user. We are able to see the Total Users next to conversions with a more realistic number, however, one must be very careful and remember it may be counting multiple conversions for one user.
UA
GA4
The Conclusion
All in all, this study was able to show how Google Analytics 4 will be measuring data in comparison to Universal Analytics. This is a big change that will require some getting used to. The biggest takeaway from this is that once you start collecting data with GA4, ensure the data you want to track is set up properly on the platform. This may be difficult to adjust to since it is a bit overwhelming to see all the ways GA4 lets you customize your data. That being said, once adjusted, you will be able to track all analytics data perfectly to your business needs.
https://tastyplacement.com/wp-content/uploads/GA4-blog-post.webp604940Michael Davidhttps://tastyplacement.com/wp-content/uploads/tastyplacementneedssvg.svgMichael David2022-11-08 09:56:332022-11-08 10:13:16Research Shows a 23% Divergence Between UA and GA4
Let’s say you have a client who insists on using a third party webform on their site. In this case, the third party is BuilderTrend. For the client this is the best option because it merges with their office workflow and the actual process of building a house. For you, the agency, this is a poison pill, because BuilderTrend has no inbuilt Google Analytics functionality. BuilderTrend put their webform inside an iframe, the most convenient solution for them. They don’t have to worry about conflicts with the host site, or communication barriers with their server. They just tell their customers to embed the iframe on the contact page, and the work is done.
For an agency, particularly one running a Google Ads campaign, iframe contact forms are exceptionally dangerous because they sever you from seeing what your users are doing. It destroys your ability to track conversions in Google Analytics (or at least makes doing so a non-trivial feat, more on this as we go). In the case of BuilderTrend (and a few other iframe form applications, such as MailMunch), we have found a solution for tracking conversions which is not elegant, but it’s at least feasible.
Why You Need Conversion Tracking on Your Website
Back in the day, in the nascent days of SEO, analytics were just an afterthought. After all, you could see how well you were doing by seeing how well you were ranking. Today, Google Analytics is a vital tool for tracking the success of a campaign. After all, you’re only doing as well as the conversions you’re getting.
Once you bring Google Ads into the equation, tracking conversions is super, super, super critical. The effectiveness of your ad spend is directly proportional to the accuracy of your analytics. The creepy AI brain over at Google headquarters will see who’s converting on your site, and then present ads to more people like that. When your analytics track legitimate conversions, this smart targeting will put you on the fast track to success. If your analytics can’t see who’s converting (because they’re hidden behind an iframe) then you might as well be flushing your ad spend down the toilet for all the good it’s doing you.
The Problem with iFrames
You can think of iframes as an HTML element which allows you to put a window into another website within your webpage. For all practical purposes, your website, where all your analytics code is, has no authority over the content within the iframe. If it’s a different domain expressed by the iframe then you can’t grab user data from it any more than you can grab the user data of people visiting whitehouse.gov or Amazon. It’s a tantalizing pool of mystery, right there out of reach. There’s no real javascript solution, and if there were, then the programming community would shut it down for security reasons. You can’t take screenshots of the iframe. You might be able to put a transparent div on top of the iframe and track cursor movements, but that won’t tell you if they succeeded in filling out the form.
There are solutions to this conundrum, which require the domain in the iframe to cooperate with you. Mostly they are variations of the cross-domain tracking solutions which you can use on multi-site campaigns. Generally you need Google Tag Manager on all the domains involved. GTM will tag the URLs with a unique user ID so that Google can match up user behavior even when different cookies are tracking those users in different locations.
Unfortunately, you need control of Google Tag Manager on both ends of the cross-domain tracking, and third party organizations like BuilderTrend can’t be bothered to help out like that. It would be a lot of extra labor hours for them to get something like that to work, and they probably worry about their customers taking advantage of the ability to insert arbitrary javascript code onto the BuilderTrend servers. In short, helping out their customers with analytics tracking would require a ground-up approach. Consider Ngage, a javascript-based chat app, which has well-documented Google Analytics event capabilities. Ngage started out as a search marketing company, so it’s not surprising that they prioritized their customers’ need to track conversions onsite.
Why BuilderTrend is so Awful
BuilderTrend of course recognizes the importance of analytics. If you look at the Tag Assistant on any page with an embedded BuilderTrend form, you will see that they have quite a lot of analytics tags on their side of the iframe. Data is money, and they are certainly not going to let any of their data go to waste. They’re just not going to spend any extra effort helping out their customers with data. It’s sheer carelessness and contempt for their customers, that they would release a conversion capturing feature that has no conversion tracking features. Shame on you, BuilderTrend, shame. I hope y’all read this and do right by your customers, and give them a way of tracking conversions which isn’t as janky as the solution I explain in the next section.
The Terrible Yet Workable Solution
This next part is where we make coding choices which are so outlandish and seat-of-your-pants imprecise that they would surely leave Google Tag Manager guru Simo Ahava spinning in his grave (he’s not actually dead, but like all Finns he presumably has a pit for curing salmon and making graavilohi).
It’s not strictly true that there’s no way to see what’s going on inside an iframe. The site inside the iframe has to want to communicate with you. Or, as is the case more often than you realize, you can listen in to the bleed-through signals. Let’s take a look at the BuilderTrend embed code. Yes, there’s an iframe with its sinister one-way window. But there’s also an attached piece of javascript. You might ask yourself, what’s that for? The answer is, it’s for the convenience of the developers. You see, BuilderTrend wants the easiest one-size-fits-all solution they can get. So if you have an embedded iframe which contains a user-customized form, how does the webpage know the best dimensions of the iframe? If the user adds a field or two, suddenly it needs to be longer. This is the purpose of the attached code, every time the iframe loads, it tells the javascript onpage the best height to style the form, to prevent the iframe from taking up too much space or using those annoying scroll bars.
There’s a comment in the attached BuilderTrend javascript which gives us a mesmerizing glimpse into the minds of the developers:
// there have been mulitiple ways of doing this over the years, unfortunately this has to support all of them
So apparently a lot of thought and development time has gone into deciding how to style the form so that it looks good onpage, but nothing for the marketing needs of their customers.
The backchannel method of communication between BuildTrend’s iframe and the client page is called postMessage. We can listen into this channel using your Chrome Developer tools. Open the page containing the iframe and then right click and select “inspect.” When the window opens up, change to the “console” tab and enter the following command:
monitorEvents(window, ‘message’)
By right-clicking on the BuilderTrend iframe and selecting “Reload Frame,” we can see that a postMessage comes through every time the iframe reloads. And if you fill it out, the iframe reloads again to display the thank you message, while once again sending a postMessage to inform the javascript function about the preferred dimensions. In the console window the important information will show up under the “data:” section.
Now that we know that the BuilderTrend servers send a postMessage with the form’s height every time the iframe reloads, we can now make an analytics event triggered by the postMessage. We like Google Tag Manager for this sort of project.
First thing we do is add a “Custom HTML” tag in GTM which pushes into the datalayer the two different data formats used to declare the frame height in the postMessage JSON.
Once we have the relevant postMessage communications in the datalayer we can trigger events in both GA4 and UA.
The customization I made to this particular trigger was to delay activation three seconds after page load, so that the initial postMessage declaring the iframe height doesn’t register as a conversion.
Why This PostMessage Tracking Method is Useful But Also Very Fragile
The reason this is a terrible solution is because there’s a lot of points where the conversion tracking could break down. We know that BuilderTrend has a history of changing the coding implementation. At any point they could change the JSON structure sent through postMessage from their silly iframe and this could break conversion tracking, leaving all of us internet marketers high and dry.
However, it appears to very nearly match up with the actual numbers of leads coming through, which is the most important part for us.
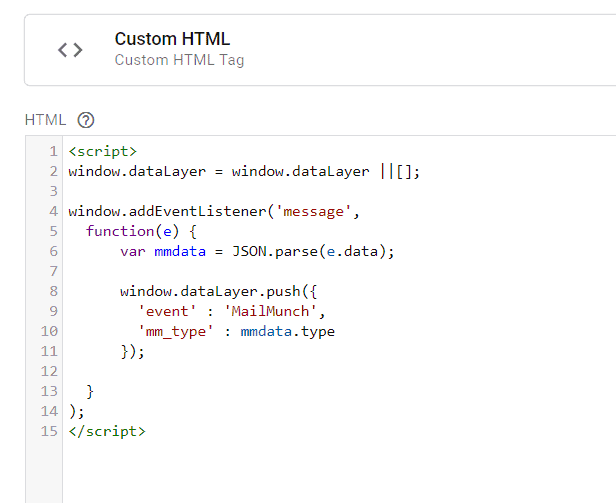
An informal (and limited) survey of these sorts of iframe forms shows us that about half leak postMessage information. We were able to use a similar method to track conversions on a Mailmunch form:
This code is a little simpler, just sending a datalayer event whenever it sees a robust data field in the postMessage JSON.
So should you check your clients’ terrible iframe forms to see if they have postMessage events? And should you cobble together a fragile conversion tracking system? For sure. But that doesn’t mean that software companies like BuilderTrend should be left off the hook. They need to show respect and consideration to their customers and their marketing needs, so that we don’t have to engineer crazy hacks just to run a simple Google Ads campaign.
https://tastyplacement.com/wp-content/uploads/postmessage.png4141049Matthew Beyhttps://tastyplacement.com/wp-content/uploads/tastyplacementneedssvg.svgMatthew Bey2022-08-11 15:51:422022-08-11 15:51:42How to Track Google Analytics Conversions on BuilderTrend’s iFrame Form
Tracking Website Goals In Google Analytics Should Not Be Optional
As TastyPlacement enters its 17th year of operation, we remain astounded how many new clients come to use with improper Google Analytics installations. We see it all, from mangled Google Analytics Snippets, to doubled Analytics Snippets. Far more common though, are websites without Goal Conversion Tracking installed–which is like going to battle with a blindfold on.
“Defining goals is a fundamental component of any digital analytics measurement plan.”
“Having properly configured goals allows Analytics to provide you with critical information, such as the number of conversions and the conversion rate for your site or app. Without this information, it’s almost impossible to evaluate the effectiveness of your online business and marketing campaigns.”
Goal Tracking, or Conversion Tracking, is very simple: when a user visits your site, Goal Tracking is a measurement of whether that user takes a specific action such as:
Dialing your company phone number
Filling out a contact form
Engaging with a live chat or chat bot
Making a purchase
It’s vital to track goals: with goals tracked you can now know valuable, actionable information such as:
Which of your paid keywords generate leads?
Do Facebook ads generate sales or leads to the same extent as Google organic traffic?
Goal Tracking Gives You More than Just Actionable Information
Now, let’s take it even farther. Google Ads can, with properly configured Goal Tracking, act on its own behalf using artificial intelligence to improve ad performance and increase Conversions. More on this in a future article.
https://tastyplacement.com/wp-content/uploads/awesome.svg00Michael Davidhttps://tastyplacement.com/wp-content/uploads/tastyplacementneedssvg.svgMichael David2021-05-19 10:03:492025-06-24 13:19:56Pro Tip: Track Your Website Goals in Google Analytics (and More)
The longer you stare at Google Analytics, the more you see things that don’t make sense. Sometimes the irregularities pop right out, users who crawl every single page exactly once in a single session, or users who load up pages that can’t possibly exist a couple times every month. Most likely these abnormalities are caused by robots, those sneaky denizens of the inter-webs, teeming in the millions and doing their masters’ bidding. Mostly the robots don’t execute javascript, so they don’t manifest in Google Analytics. And you can filter out a lot of the robots which do use javacript by clicking the “exclude known bots and spiders” box in your GA view settings.
Why this box wouldn’t be checked by default is anyone’s guess. Between views where you forget to check off that box, and robots which get around Google’s filters, you will see a lot of this fake traffic once you start to look.
A few months ago we noticed one robot in particular which stood out from the others. Instead of hailing from Russia or the Philippines, or some other sketchy location, it seemed to originate from right here in Austin, Texas (also an admittedly sketchy location). The pattern was a single user loading all of the pages on the site one right after the other.
This crawling seems to have started within the last year or so, and the declared user agent was an outdated version of Firefox. Once we made a segment which isolated the stats we found it everywhere. It was like that scene from Independence Day where Jeff Goldblum discovers that there’s an alien signal inside all the telecommunications satellites.
Drilling down to all the dimensions allowed by Google, we found the smoking gun under Audience –> Technology –> Network.
We believe the robot is how Indeed.com gets some of its job listings. It scrapes the entire dang internet to find those sites where the companies can’t be bothered to post directly to Indeed.com.
Here’s the stats for identifying the Indeed bot: City: Austin or sometimes Denver Network: indeed inc Nework domain: cyrusone.com source/medium: direct/none Browser: Firefox, 38.0, 1024×768
If Indeed has the hardware and expertise to scour the digital world with a fully rendering bot, you think they could also make it not execute Google Analytics. Just saying.
A Few Other Robots of Note in Google Analytics:
New York Mystery Robot
Appears to be probing sites for security flaws. Deliberately loads 404 pages with mysterious hashes in various subdirectories, such as /blog/aHQtZ3JvdX . It’s declaring the browser to be a year-old version of Chrome. One theory is the hashed 404 pages load up remote shells. Or maybe that’s just being paranoid. Nearly every site has dozens of visits a month. City: New York Network: microsoft corporation Nework domain: unknown.unknown source/medium: direct/none Browser: Chrome, 57.0.2987.133, 1280×960
Amazon Bing Bot
Surprisingly pervasive, sometimes visiting every day. Usually loads homepage, but sometimes a gibberish 404 page. It’s really apparent if you visit the Acquisition –> Channels –> Organic page, the keyword “Amazon” shows up right near the top. It’s not clear what they’re trying to do here, there’s no obvious spam message, and they’re not crawling much content. City: Santa Clara/Anaheim/New York Nework domain: paloaltonetworks.com, unknown.unknown, keznews.com source/medium: Bing/Organic: keyword “Amazon” Browser: Internet Explorer 8, 800×600
Weird Brazil Traffic
It’s probably no surprise that if you’re getting Brazilian traffic on a Texas home-services site, that the Brazilian users are probably not actual prospect customers. A variety of cities in Brazil are the homes to bots which methodically crawl all a site’s content. City: Itacoatiara (Brazil) Nework domain: sovereignease.com source/medium: direct/none Browser: Chrome, 52.0.2743.116, 1920×1610
https://tastyplacement.com/wp-content/uploads/tastyplacementneedssvg.svg00Michael Davidhttps://tastyplacement.com/wp-content/uploads/tastyplacementneedssvg.svgMichael David2019-04-02 15:09:052022-04-15 15:16:19How to Recognize the Indeed.com Robot and Other Unwanted Visitors
Analyze your data for particular parts of the country to make better advertising decisions
This task came up recently when we were analyzing a particular PPC campaign–one of our own, actually. We run some remarketing and display campaigns throughout the US and Canada. We are always looking for hour of the day optimization (dayparting as it was called on Madison Avenue). However, when we ran an hour of the day analysis aren’t we looking at, say, 12 noon in Chicago and 10am in California?
This would seem to muddy the data: we are looking for particular hours of the day when website conversions are strongest, and since it isn’t the same time of day everywhere on a continent, we want to separate and segment the data.
Google Analytics “Hour of Day” Report
Google Analytics Hour of Day report shows us what we need: aggregate Adwords visitor data segmented on a 24-hour graph. We’ve set the following chart with a secondary data point, the Goal Conversion Rate:
Of course we care about conversion rate–that’s why we run ads, to get customers to reach out to us for further consultation.
And we can see from the chart that we’ve got a mixed conversion rate throughout the day. Keep in mind, we have our analytics set to (and have a headquarters in) the Central Time Zone in Austin, Texas. We like our conversion rate at 12 noon and 2pm, and clearly the conversion rate trails off in the evening after 4pm/5pm.
But even with this valuable data, our 12 noon is 1pm on the East Coast, and 12am on the West Coast.
Let’s Increase Our Accuracy With Segments
We want to see our hour of the day report for only those users actually in the same time zone. To do this, let’s create a custom segment in Google Analytics.
1. At the top of any report in Google Analytics, look above the chart and click “+ Add Segment”, you’ll find this right next to a button titled “All Users”. You’ll see the segment selection window:
Note that “All Users” is already selected in the segment selection window. That’s because technically, “All Users” is a segment, it is simply a segment with no filtering that allows all users in.
2. We could select an existing segment, but here, we’ll create one. To do so, click “New Segment”. As a heads up, we are going to create a segment based on states that exist within the Central Standard Time Zone. Some states bleed into neighboring time zones, so we’ll fudge it. Here’s the screen where we create our segment, with a few fields filled in:
We’ve gotten started a bit with the previous screenshot. We’ve named our segment “CST Zone States”. Next we’ve made selections to the “Location” fields. “Region” lets us segment by states, and “Matches Regex” lets us use regular expressions to add states in series, with each state separated with a “|”, the pipe character. To add most of the states from the central time zone, you can enter the following into the Location/matches regex field:
With this same technique, you can create segments that group cities together, group states together, or simply isolate particular geographic locations. Google Analytics Segments are very powerful tools and are commonly used by the best and the brightest.
Let’s Apply Our Segment to the Same Report
And when we are done with our segment, we simply click “Save”. Here is our new hour of the day conversion report.
A few facts become immediately apparent. First of all, we have a more stark difference between high-converting times during the work day and after hours. In fact, the period of 17:00 (5pm) to the workday morning is almost totally dead. Keep in mind that when you work with segmented data, you might be substantially reducing your data set. In our case, we were now looking at only 30% of our total PPC traffic, and 1% or our total website traffic. If you over-segment, you’ll have tiny data sets and your insights won’t be meaningful.
Get Creative With Google Analytics Segments
You can do a lot with segments–essentially anything tracked in Google Analytics can be isolated and grouped with a segment. Just imagine: you can segment mobile users in Florida that arrived to your site via organic traffic. We use about 60 custom segments in our reporting to clients.
https://tastyplacement.com/wp-content/uploads/tastyplacementneedssvg.svg00Michael Davidhttps://tastyplacement.com/wp-content/uploads/tastyplacementneedssvg.svgMichael David2018-08-30 11:22:502018-08-30 11:23:00Analytics Tutorial: How to Segment Out Time Zones & Regions
https://tastyplacement.com/wp-content/uploads/datastudio.svg00Michael Davidhttps://tastyplacement.com/wp-content/uploads/tastyplacementneedssvg.svgMichael David2017-10-12 10:00:392018-04-10 15:01:03Instructions: Connect GMB Insights to Google Data Studio
https://tastyplacement.com/wp-content/uploads/google-data-studio-logo-1.jpg268740Michael Davidhttps://tastyplacement.com/wp-content/uploads/tastyplacementneedssvg.svgMichael David2017-09-22 14:35:142018-06-22 10:31:25Google Maps/My Business Insights in Data Studio [SOLVED]
Intro to Installing Dynamic Remarketing on Shopify
Before we get started, let’s make one thing clear: The instructions below are only applicable to those of you wanting to set up Dynamic Remarketing through Google Analytics (GA).
Before We Begin
As with any Remarketing Campaign, make sure the following steps are completed before you continue:
Enable “Remarketing” and “Advertising Reporting Features” in Analytics
Link your AdWords and Analytics accounts
Link your AdWords and Google Merchant Center accounts if you’re in the Retail vertical
Once you have completed the above steps, you’re ready to get started with the fun stuff!
Next, Create Custom Dimensions in Google Analytics
Next, you will want to create custom dimensions in Analytics using the attributes for your specific vertical. In our example, we are working with the Retail vertical, but you can find a complete list of verticals and attributes here.
Add Custom Dimensions to Your Shopify Site
You’ll want to make sure that these dimensions are added to the code of your Shopify site. This ensures that when potential customers are served your Remarketing ad, they will be shown the exact products that they viewed on your site.
If you’re in the US, you shouldn’t need to change any part of the following code, however, if you’re in the UK, you will need to replace “US” with “GB.”
Now the big question: Where to paste it. Intuitively, you would think it would naturally go in the “Add Custom JavaScript to Analytics” box on your store preferences page. We tried that too, but quickly found that the custom dimensions were not populating in Google Analytics. To get everything running nice and smooth, you will want to follow these steps:
In your Shopify dashboard, select “Online Store”
In the themes tab, click the box of 3 dots in the top right corner
Select “Edit HTML/CSS”
Click theme.liquid in the Layout folder
Scroll to the very bottom and paste your code directly after the closing body tag
Congratulations! You’re just about ready to start showing all of your competitors what a digital marketing wizard you are.
Create a New Dynamic Attribute in Analytics
Assuming you already have your Remarketing audiences set up in Google Analytics (if not, learn how to set up Remarketing Audiences here) the last step is to create a new Dynamic Attribute in Analytics based on your business type.
To do this, go to the Admin tab of Analytics, under Property, select ‘Audience Definitions’ then ‘Dynamic Attributes.’ Here you will click “+New Attribute” and select your vertical. For Retail, you will want it to look like this:
Once you have completed this step, click save, and you’re all done! Go ahead and start building out your Dynamic Remarketing campaign in AdWords and watch the revenue pour in. Sit back and relax, you’ve earned it champ.
https://tastyplacement.com/wp-content/uploads/shopify-thumb.svg00Matthew Beyhttps://tastyplacement.com/wp-content/uploads/tastyplacementneedssvg.svgMatthew Bey2016-08-16 14:57:092018-10-22 10:28:57How To: Install Google Analytics Dynamic Remarketing on Shopify
…with a bonus: Mobile Device Detection (updated for July 2017)
Here’s the need: we have a responsive website, as pretty much 1/3 of the web has these days. We love receiving emails through our contact form from customers, and they are easy to track as Goals in Google Analytics and we feel they represent a more interested and more serious purchaser. But we also receive phone calls are those are more problematic: tracking a click to call hyperlink is easy if you assign Analytics event tracking to the click. But a problem arises: if desktop users click on the phone number looking for a contact page (they do), then the desktop user registers an event, polluting your Analytics goal tracking with meaningless clicks. So, can GTM be leveraged to only register mobile clicks on the click-to-call link?
So here’s what we want to do with Google Analytics and Google Tag Manager:
We want to create a tracking event that registers customer phone calls as an event/goal
We want to track only mobile phone clicks, and not errant desktop clicks to keep our data meaningful
We know we can do it with Javascript, but we want to do it in Google Tag Manager so all our tags are in one place and so that we can repeat the technique on any site without rewriting and installing the code on every site we work on
Getting Started: Create the Tracking Event (As a GTM Tag)
To create the event tracking, open your GTM account, navigate to “Tags” and click the “New” button and then select “Universal Analytics” from “Choose tag type”. You want your new tag to look like this screenshot–and you might have to return to these tag parameters to edit it because we haven’t created the “Call Now Click” trigger yet that is shown in the picture:
You don’t need to configure Google Analytics to create the event, Google Analytics will “listen” for our event and store events under “Behavior” and “Events”. Note how our choices of Category/Action/Label appear in our Analytics Account based on the settings above. We want the “Label” to tell us which URL the user was on when they clicked the button; that’s a powerful benefit of GTM that would be a quagmire if coding in javascript. With this little trick, we’ll know which page generated the conversion.
Next, We Want To Fire Our Tag Only on Phones
Key to having good data is to make sure the event is only triggered when the click is generated on a mobile phone, not a desktop or laptop computer which, obviously, has no phone capability. We can isolate phones among our website visitors by creating a user-defined variable in GTM that records each user’s browser width. Smaller screen width means mobile browsers (in nearly all cases).
Let’s browse in GTM to “Variables”, and in the “User-Defined Variables” section, click the “New” button. At the “Choose variable type” pop-up, select “custom JavaScript”, because we’ll be writing a few lines of code here.
We’ve named our variable “Pixel Mobile Screen Width Test”, and selected “Custom Javascript” as the Type and then entered the following small javascript string:
function () {
 var width = screen.width;
return width;
}
Our user-defined variable in GTM looks like this:
What this string will do is set a variable based on the user’s screen width. In the next step well set a trigger that is dependent upon the screen width being below a certain pixel size–we want to fire our event only when Does a narrower screen width necessarily mean the user is on a phone? No, not with 100% certainty, but for our purposes, it’s close enough.
While you’re in the variables section, enable the Click Url variable by clicking “configure” and then the checkbox. For some reason the pre-configured variables aren’t automatically available, you have to manually enable them.
Tying it All Together With a GTM Trigger
Now we tie together our screen width variable and our Google Analytics event tracking with a GTM Trigger to fire the event tracking and register our click in Google Analytics. In GTM, navigate to “Triggers,” then click the “New” button. We are going to create a trigger with the following parameters:
Event: Click
Configure Trigger: Just Links, Wait for Tags, Max wait time 2000 milliseconds, Check validation
Enable When: set this to “Pixel Mobile Screen Width Test” less than 800. That way the tags won’t spring into action unless it’s a mobile device.
Now to set when our tag fires: set to “Some Link Clicks” and change the “Click URL” to “matches RegEx” and then your phone number. It may be easier to just match the last four digits of the phone number, because if people have been putting hyphens in the tel:URLs, that will make a regular expression match a giant pain.
You might notice the “Page Path” argument–you won’t need that unless you have a specific page on which you do NOT want the tag to fire. In our case, we have some sample code that might have caused errant triggers, so we wanted to exclude that page.
So, let’s break this all down: under the “Fire On” section, we want to fire the event tracking when the Click URL matches 5125352492, which is the anchor text in our click to call link (our phone number, obviously). We have another condition though, which is that we only want to fire the event tracking when the screen width is less than or equal to 600 pixels, which refers to the user-defined variable we defined above. Save the trigger, and start testing. There are probably other (and better) ways of doing this, but this meets our requirements; it’s reliable and repeatable. Also, our method will work with anywhere we put a click to call button on our site. Maybe we have a link at the top of the page and at the bottom: either link would register as an event as long as the anchor text of the click to call link is the same. Also, I like how we’ve set the event tracking label to show the URL of the page the user was on when they decide to call.
For troubleshooting, you can use GTM in preview mode. Matthew Bey, our operations manager, developed this solution with lots of reference to Simo Ahava’s blog.
https://tastyplacement.com/wp-content/uploads/tagman.png350511Michael Davidhttps://tastyplacement.com/wp-content/uploads/tastyplacementneedssvg.svgMichael David2015-07-12 21:12:042018-06-20 11:20:50Click to Call Tracking With Google Tag Manager: Tutorial